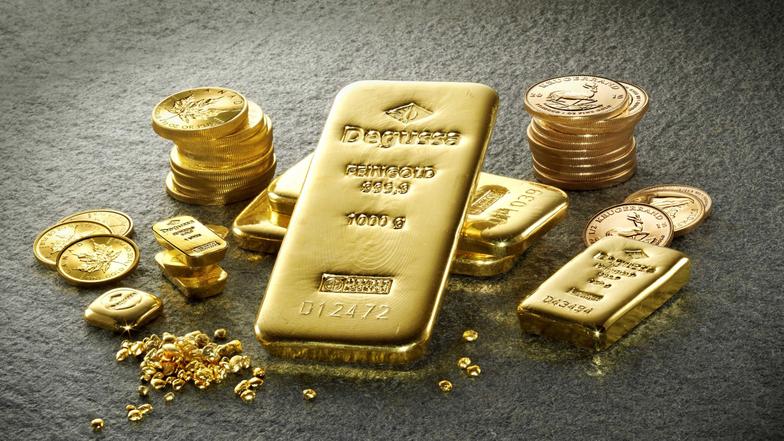
When gold smells like tulips
Since the price of gold stood at around $2,060 an ounce, in the second week of August 2020, its successive falls have been warning of the end of the bubble, which was a unique opportunity of bullish speculation and that we anticipated in January 2020, when it was attempted to be related to Iran's conflict with the West. Now, having fallen almost $360 per ounce from that high and pausing, the question arises as to whether bearish speculation will continue to make its way, a topic that we will explore today and which has interesting surprises. But before getting into the matter, we will remember the basic criteria for participation in this market.
The keys to gold
The details of these keys arise from the study of more than a hundred years of statistics that we summarize in two articles, “The gold bubble” and “The gold graphs” (both profusely plagiarized, by the way), so we will not repeat it but we will go directly to these keys, which are the following:
Pattern and hoarding
As we always say, "the pattern is the prologue" and, when the price of gold is studied in real terms (discounted inflation; maroon line, next graph) it is observed that makes a secular ceiling around $800 in 1983 purchasing power. It is also observed that, in the last 54 years, he has made three secular floors (which is when you have to treasure), which are like three steps; the first was close to 100 real dollars, the second at 200 real dollars and the last one was around 500 real dollars, a good revaluation if you do not count the costs of ensuring the chain of custody, of course.
These three steps have been ascending because the effective demand, that is, the one that overcomes the total production capacity, the global supply, has increased structurally, which leads us to the next point.
The demand for gold
What can be seen here is that after the strong Chinese expansion (until 2013), the main cause of this third step, it contracted (dark yellow line, following graph), while that India's has been contracting since 2010; the rest of the markets are not very important in price formation. Of course, in the total of the main markets (black line on the right axis) the sharp fall in 2020 due to the closures of the pandemic stands out, although it also fell in 2019; the only country of a certain volume with a significant increase is Turkey, but it is because of its risk of hyperinflation and implosion.

Regarding the demand for uses, apart from the contraction due to covid-19, the drop in the provisioning of central banks stands out, the majority of pariah countries, which is logical, given the high price of the bubble (until they have noticed). The World Gold Council calls "bars and coins" "investment," but in reality, along with "for jewelry" (to make alloys), it would be hoarding; then there are the "ETFs and the like", which are instruments of speculation and logically rise strongly (we are in a bubble), going from 398 to 896 tons. Thus resulting in the fall in total demand, which was almost flat since 2013, has been 14.3% compared to 2019. And the supply? Let's see it.
Supply and storage
Gold production has not stopped due to the closures - although there have been logistical problems due to the stoppage in air transport - but rather has followed, more or less, the usual levels since 2016, that is, 4,633 tons in 2020; This has meant a record increase in inventories in 2020 of 873 tons, which added to the increases of the decade increase them by 2,249 tons, equivalent to half the production of a normal year and whose storage cost is onerous.
We do not know the total inventory data at closing, but we do know that in 2013 they supported a cumulative reduction of 467 tons, so saying that today they would be above 3,000 tons is reasonable. If this were to hit the market this year along with the ETFs (877 tons) - 912 tons were released in 2013 - we would add more than the sales of 2020 and the debacle would be tremendous.
Then, gold accumulated by individuals could go on sale in coins and bars, whose acquisitions, with so much bubble, are almost half those of 2013, and who have excellent platforms to store physical gold - and what always they forget, to guarantee the chain of custody, for what they are charged -, with which they can also speculate, although they are more expensive.
But will 2021 be a year with normal demand? Obviously not, so it's going to be very interesting to see how strong hands avoid a selling panic and whether they can make a "distribution" of that caliber. So far they have cleared the $1,700 an ounce barrier well, which brings us to the next point.
Technical analysis
Another surprising element of this bubble is the extraordinary resemblance of the current market ceiling (following graph) with that of the previous one (bubble that we warned about here and from which I still drag enemies who are dedicated to to defame me); In addition, this is a market that follows the moving averages well but that also gives its deceptions ("bear/bull traps"), such as when it made a triangle with bullish possibilities (black arrows) that made us think of another bubble, which did not it gave then but something later (red arrows), something that we warned, alerting again that it was not time to hoard but to speculate, because everything is about those two things, not about "investing".
As a future strategy, if the strong hands cannot make the "distribution" referred to, it could be interesting to follow the Fibonacci retracements on the movement started at $1,050 per ounce to the top of just over 2,050, a thousand points that they make it very easy to calculate them and have indicative marks. Said setbacks would be 38.2%, 50%, 61.2% and 100% of those thousand dollars (2,050-1,050), giving the prices of 1,668 (it almost did it on 3/8/2021), 1,550, 1,432 and 1,050, as points of interest. The most important mark would be at the price of $1,550 an ounce, after which it usually returns to the starting point, that is, at $1,050 an ounce; The English version of Wikipedia on Fibonacci retracements has a graph (link) that illustrates this phenomenon very well.
The bottom of the market
$1,050 an ounce (or its surroundings) is of interest, since in the previous debacle, which we warned about, there was much talk that they would have to close below $1,100 many mining operations, that equalization of the marginal cost and the price could be a good floor for the offer.
As for hoarding, the prudent thing to do is to wait for it to make a lateral movement, similar to the previous ones, and for that to happen, there will be a long way to go; which is boring, yes, but by then whoever wants emotions should go to cryptocurrencies. So, as we have recommended before, this bubble is a good opportunity to sell a part of the hoard and cover the costs of storage and chain of custody.
There are those who self-interestedly announce a Turkish-style global scenario, with hyperinflation and other misfortunes but, today, that is absurd; Furthermore, given the structural situation of supply and demand, I do not see it as possible to sustain this bubble, much less a euphoria like that of the tulips. And what do tulips smell like, that typical Easter flower? Well, some have a raw chestnut aroma, we all know how that ended. In any case, good luck and take care of yourselves.


